By E. K Benj & Makerere University Researchers.
Did you know?
- The land fill at Kiteezi is now 42feet!
- About 600 people earn their daily income from sorting rubbish.
- The liquid that is filtered from the rubbish is drained off and is highly toxic!

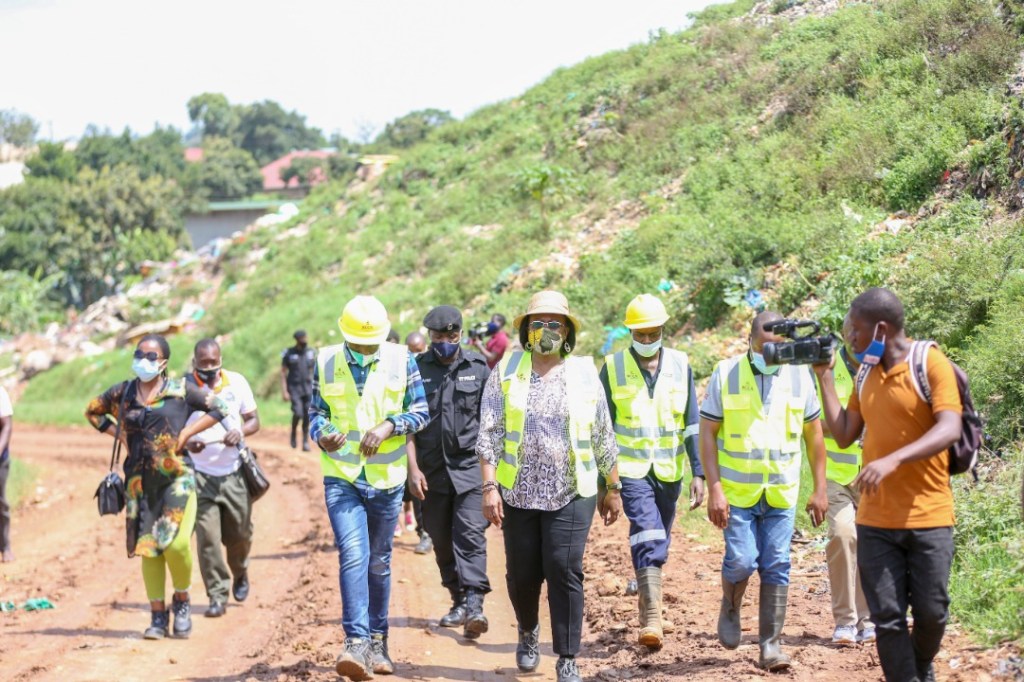
Mrs Dorothy Kisaka new Executive Director of Kampala Capital City- KCCA led a team of KCCA officials and Journalists on Saturday 24th October in Ddundu, Butaba village in Mukono District where a new waste management site is situated.

Architecture in Kiteezi
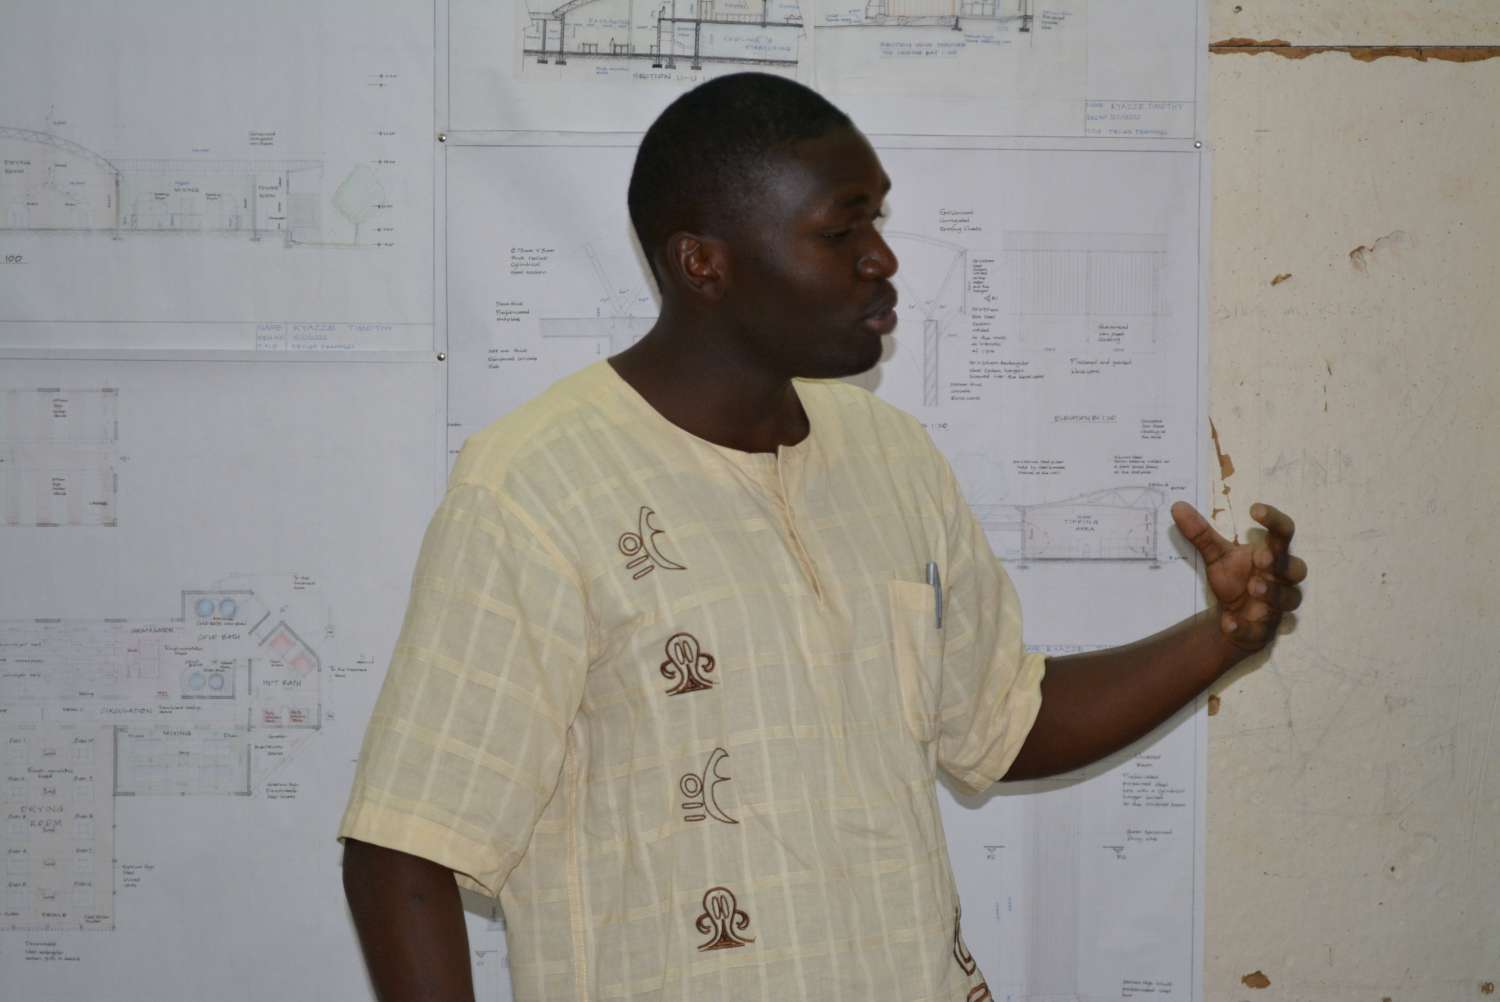
Makerere University Department of Architecture and Physical Planning, on March 18th, 2015 hosted a team of officials from Kampala City Council Authority. The purpose of the visit was for KCCA officials to familiarise themselves with some of the research project ideas that the students had in regards to how best the authority can deal with garbage at the Kiteezi landfill. The 3rd-year students had undertaken a 3-months research project at the landfill. Many advised on making pipes out of the plastics at the site, plastic doors, pipes, tiles, gas, cards, bricks etc.
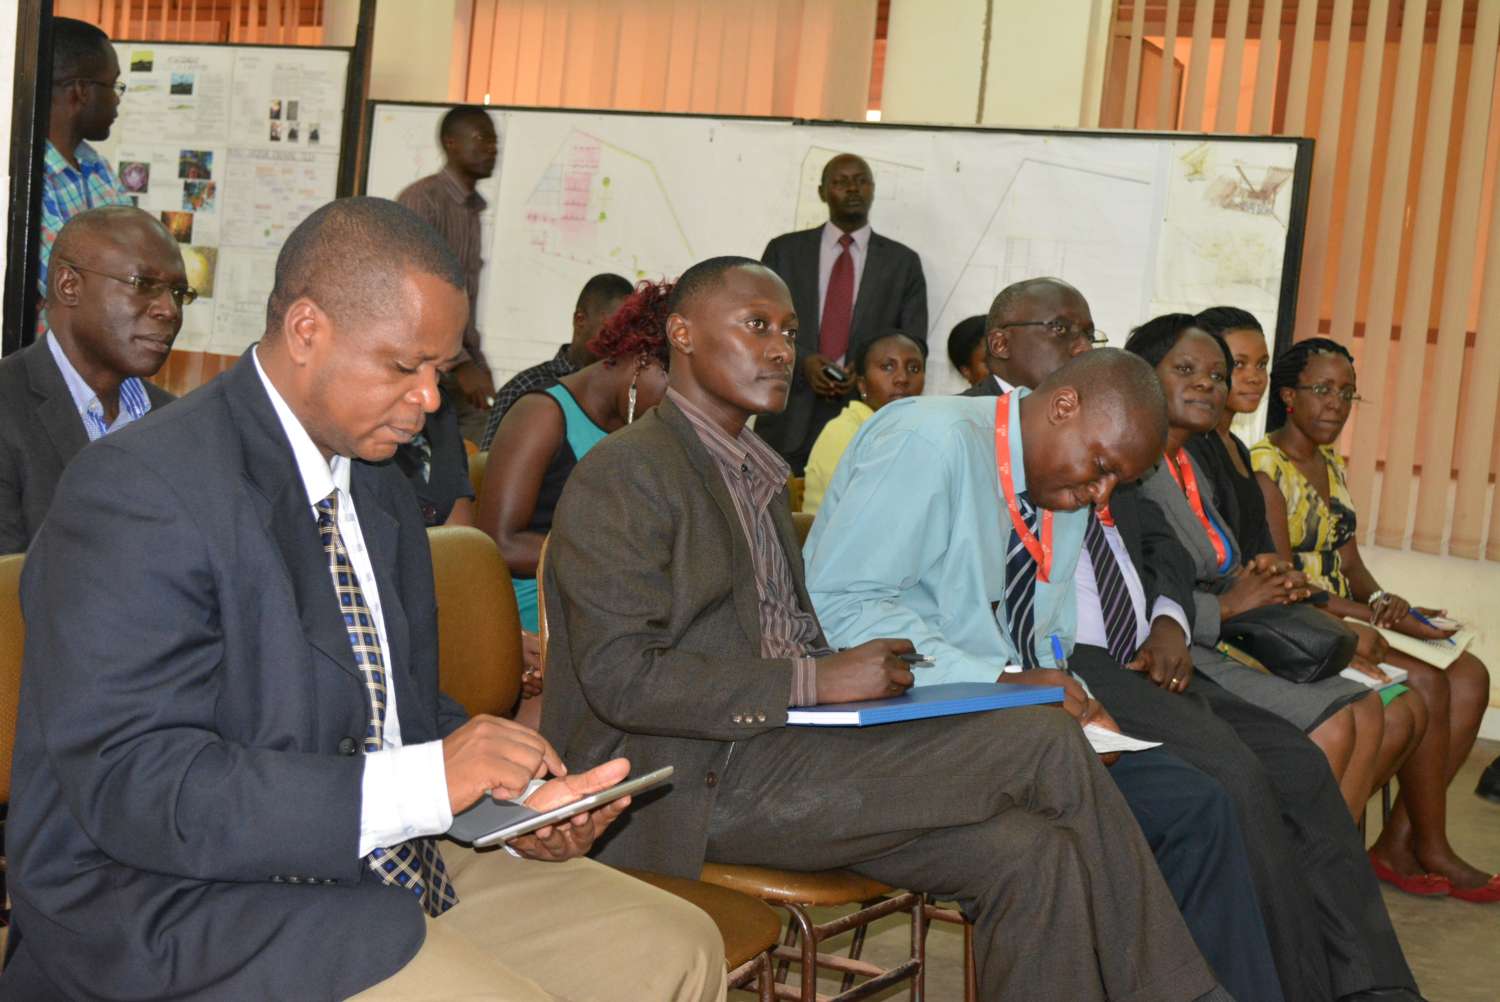
The officials from KCCA included; Ms Harriet Mudedo, the Director Gender CS&P, Ms Esau Galukande, Deputy Director Production and Marketing, Dr David Serukka, Lutakome Obed, Nakitingi Doreen, Godwin Kamugisha and Nyamatte Damalie.
This work was supervised Dr Nnaggenda Assumpta and Dr. Ssemwogerere Kenneth.
Below are some of the research projects/ proposals on how best to utilise the Kiteezi landfill/ the factories that could be set up in the area.
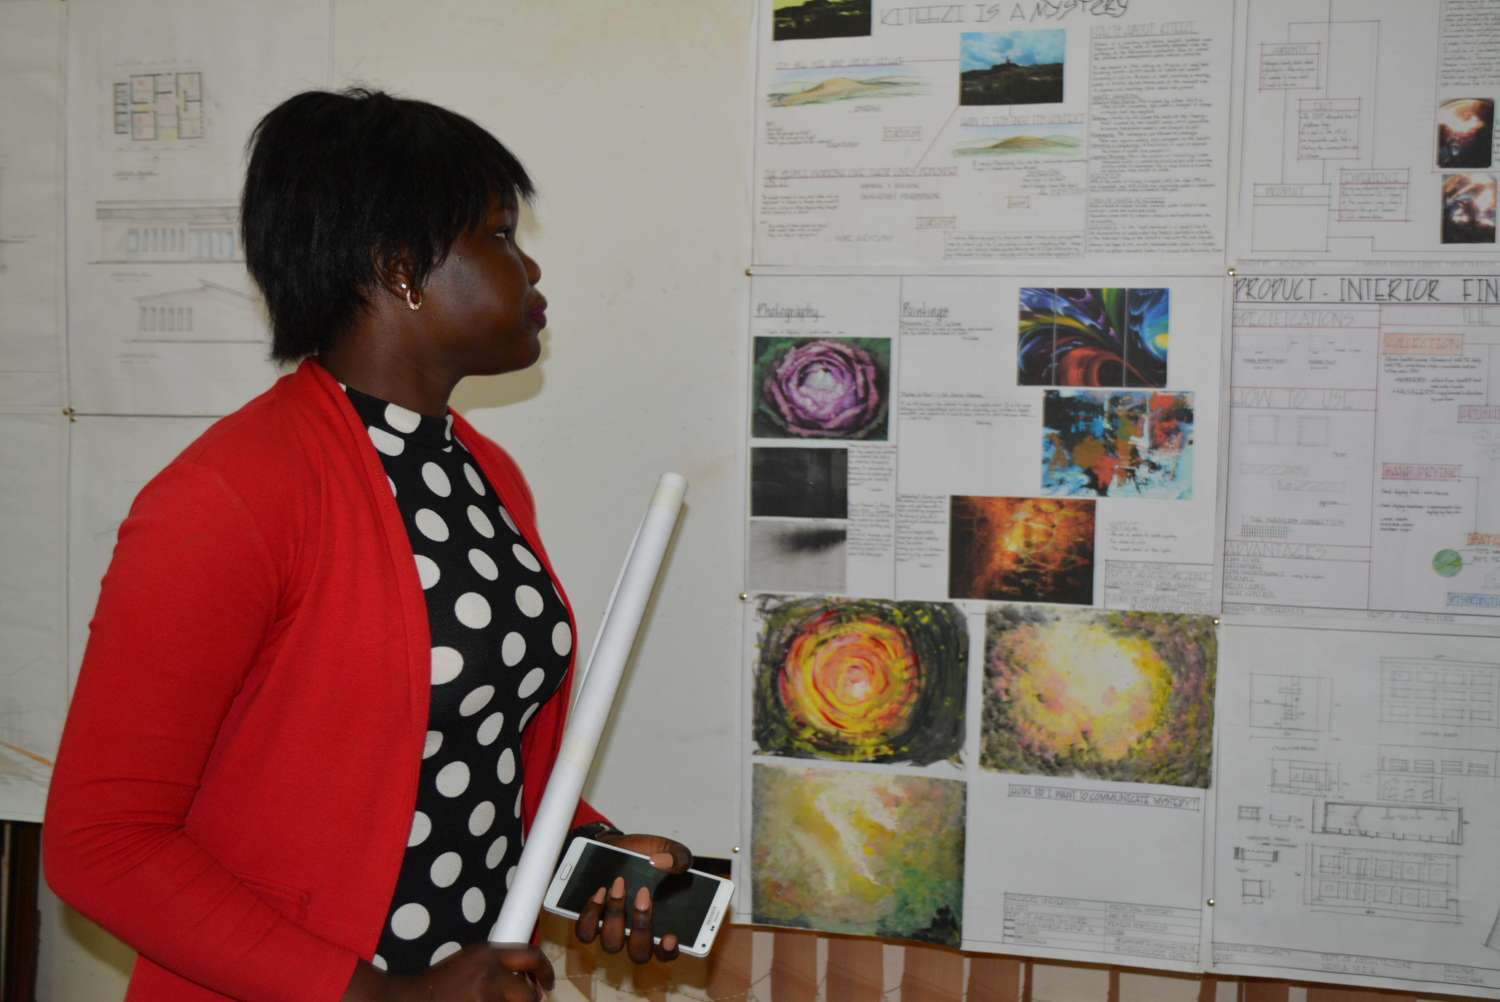
PROJECT NAME: PLASTIC INTERIOR FINISHING TILES FOR A BETTER KAMPALA
By Edna M M Amayo
Kiteezi landfill located in Mpererwe is Uganda’s largest and only sanitary engineered landfill with its highest end rising up to 10 metres, sitting currently on 36 acres of land. It receives 1000 kilos of waste daily with under 400 salvagers working in the landfill every day in harmony.
The mysteries of Kiteezi’s great size arise from the slow decomposition process that is a result of unsorted waste, that is 15% inorganics and 85%organics collected from source together and disposed of at Kiteezi. Out of the 15% of the organics, 1-2 tons of that is plastic, and of which 30% is salvaged leaving an alarming 70% – which includes polythene paper bags, commonly known as “kaveera”.
This makes kaveera a readily available raw material for a potential factory near Kiteezi. Choice of such a raw material can be complimented by the 2009/10 budget ban on kaveera where 20% was manufactured locally and 80% imported as per 2003 and the rising numbers of polythene bags floating in various streams and drains all over Kampala city, and littering of streets.
Considering its properties, both physical and chemical, kaveera can be manipulated in a simple process of; washing, drying, sorting, shredding, batching with sand, extrusion, pressing and printing- if necessary- to produce plastic interior finishing tiles. The advantages of plastic tiles include; durability; easy installation; low maintenance; cost effective; recyclable.
The construction industry contributes over 12% to Uganda’s GDP and has witnessed a steady growth for the last 20 years and despite the recent upsurge in inflation, the sector has remained on a steady path of growth and development (Uganda National Commission for UNESCO, 2013). Hence the manufacture of these tiles would be a great contribution to the growing construction industry and possibly the GDP through exports.
Lastly, the process for the manufacture of these tiles will require housing, hence the need for an architecture that is both feasible and sustainable right from the external façade to the interior main and support spaces, and efficient circulation systems, not neglecting required building services for proper functioning of the factory and the building as a whole.
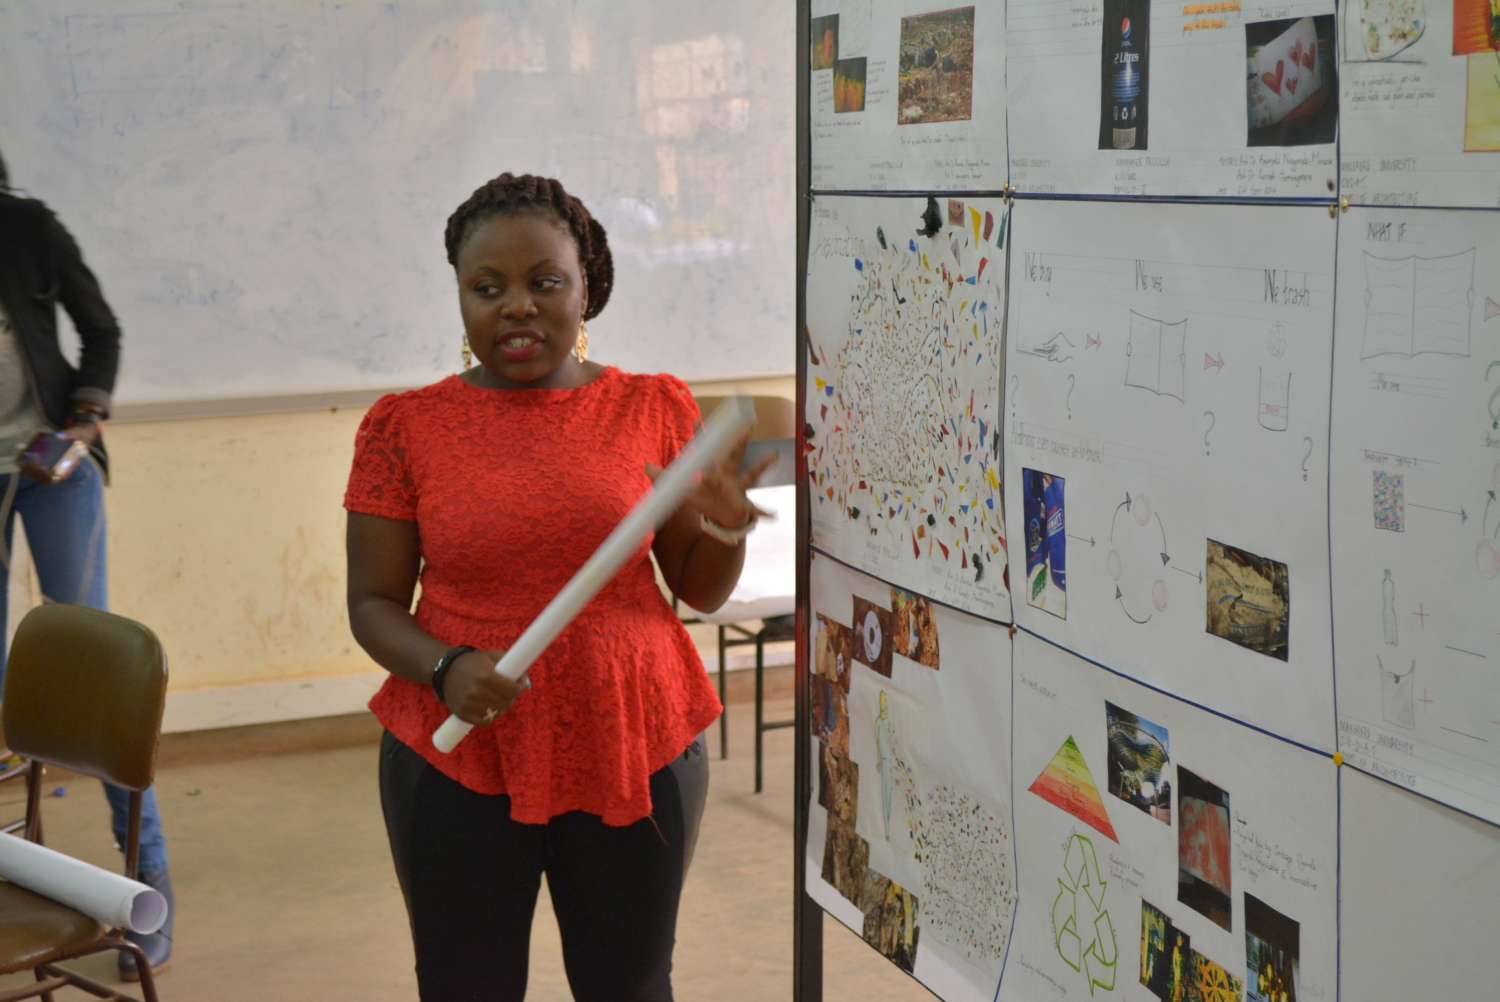
PROJECT NAME: THE ENDLESS SET.
By: Namwanje Priscilla
I got to Kiteezi, expecting to have an unpleasant experience. It is the largest landfill, ‘garbage dump’ in the country after all. But, to my surprise, I found a small community of people, birds, insects, almost like a world of its own, co-existing in harmony at this overwhelmingly large mountain of garbage. Amazing! I was further astonished, after I took a closer look at what the garbage is comprised of and discovered that it’s our lives. Small pieces of who we are, things we once loved, photographs, shoes, bags…stuff that actually meant something. It was all thrown away.
On realisation that we are literally throwing away our lives, I sought to back track the process and see if I can find the reason or any missing link. Why are we throwing all these things away? Anything that could cause us to stop/ pause and think…anything. I searched through a dozen of dustbins, went through shopping carts at the supermarket. I found nothing. It was just a helpless situation. We buy something, we use it, and we throw it away. End of story. Nothing along this process causes us to pause and think.
At this point, I knew exactly what kind of product I should produce from the garbage.
The Endless Set is a set of cylindrical jars made of out broken pieces of glass that are joined to each other using plastic. Each jar varies in size. The reason for this is so that the product can suggest various uses or should I say, endless possibilities. It can be a lamp shade, flower pot, candle holder, pencil holder, cup, interior décor…the list is endless. Why broken glass? I want the product to be able to trigger/invoke thought…some sort of question from the user.
The idea behind this product is a new approach to product design. For so long, our waste management campaigns have targeted the consumer, and not the commodity. I believe that’s where the answer lies! What if producers made ‘endless sets’ of everything? Products with more depth. Products with a less obvious fate of winding up in the trash almost immediately after they are bought. Imagine if the plastic soda bottles were designed for more than just one use, and after taking soda, you’ve got yourself a new pen holder, or television stand or an entire list of endless possibilities! Maybe then, we can tackle the issue of high levels of waste accumulation in our city and our country. And reduce on the rate at which Kiteezi is filling up…otherwise, in a couple of decades from now, we could possibly be looking at districts of garbage!
PROJECT NAME: FUEL PELLET MANUFACTURING INDUSTRY
By: Opolot Jackson
Kiteezi dumping site is an engineered land fill for Kampala city commissioned in 1996 and meant to run until 2011. Disposed waste comprising; organics 83.5%, Metal 8.6%, Paper 5.4%, Plastics 1.6%, Glass 0.9%, at Kiteezi land fill has increased from 1,400 to 1,700 tonnes daily. The above statistics express that the rate at which the waste is accumulating is exponential. “Compacted waste, 10 stories high, caused garbage to spill over the gabion retaining walls partially burying the leachate treatment plant expressing that the capacity of the land-fill has been exceeded,” Mr Obedi Lutakome, the Kiteezi Site Engineer, said in an Interview.
As such this project hopes to curb the exponential growth of the waste as compared to the limited land solution for landfills by turning organic waste into environmentally friendly fuel pellets. Biomass pellets are a sustainable fuel source with low co2 emission used for domestic heating and running steam turbines in industries for power generation among others.
Fuel pellet manufacturing is composed of 5 key processes:
- Receipt & processing of the feedstock; storage and sorting of the garbage to pick all non-organic elements within the garbage.
- Drying; use of a rotary drum dryer to decrease the moisture content to a range of 10 – 15%.
- Grinding; the biomass is ground to a finer powder, starch binders are then added to facilitate the sticking together of the particles.
- Pelletisation; using steam the powder is moist to 1-2% and compressed through a die to produce the pellets and allowed to cool.
- Packaging & storage; the pellets are stored in 25, 50 and 100 kilogram sacks for domestic use and jumbo sized sacks of 500 and 1000kg for industrial use.
The industry would be located on a 2.5 acre, irregular 5-sided polygon, site. A multi-level roof system appreciates the varying site topography while various green spaces balance out the “hard” surfaces making the site cool and inviting. The exterior walls are built from concrete blocks and finished with rough-cast.
The building is zoned into four major spaces;
- Feedstock & storage; a double volume space with a floor laid to a 6° fall finished with terrazzo, a low maintenance finish. While Pompeii grills facilitate passive design to counter the stench from rotting garbage.
- Sorting on the 1st floor; single volume space with sequenced 1200 x 600mm pivoted windows on the east and west faces of the building aiming at ‘releasing anxiety’ in the space while catering for passive design.
- Production; a tunnel like space with a polished granite floor finish that punctuates the transition between processes, fixed floor to ceiling windows open the interior space to the compound while Pompeii grills ventilate the space
- Packaging & Storage; a double volume space with steel, floor to ceiling storage racks, bolted into the walls and anchored into the rough concrete floor, Pompeii grills at a 4500mm sill-height keep the room aerated.
In conclusion, recycling and use of landfills for waste-disposal doesn’t provide a permanent solution. If better ways of optimising waste as an energy source are realized a new dimension could be added to the concept of energy efficiency. Thus I believe this innovation will be of great importance to the immediate Kiteezi community and Kampala at large.

Waste Treatment and Disposal as ealier published by KCCA.
In Phase II, KCCA will tender a joint concession for the existing Kiteezi Landfill and a future waste disposal site, make available the necessary land for a new site for continued disposal after the end of the life of the Kiteezi site, identify and make available a site for a transfer station (possibly at the existing Kiteezi site), and ensure that all waste collected in Kampala is directed to the designated disposal facilities (as a condition of all collection licenses issued).
The operator for waste treatment will design, build, operate and maintain a sanitary landfill and waste treatment facility at Ddundu in compliance with Ugandan and international standards; close the landfill sites at the end of their useful life, provide aftercare and collect LFG (if deemed viable) on completed sections of the landfill; employ an appropriate choice of technology e.g. composting, Energy from Waste, Anaerobic Digestion, etc.; exercise commercially viable means of formalizing the work of existing informal workers on the site; and establish and operate a transfer station at a designated site if required in the service level specifications.
Already, KCCA has purchased 135 acres of land (at Ddundu) for this purpose and procured Transaction Advisory Services of the International Finance Corporation (IFC) for this forthcoming PPP contract. We shall have an investor promotion conference in September 2016 where we will appraise the prospective investors of the opportunities in the waste management industry.
Next Steps
- Source for funds to continued sensitization of both the political leaders and the public.
- Continue to address the emerging issues with the concessionaires in line with the conditions of the contract
- IFC to complete Transaction Advisory Services for Phase II of the project in June 2017.
- IFC shall conduct an investor promotion conference in September 2016 where we will appraise the prospective investors of the opportunities in the waste management industry.
- Procure, under a PPP arrangement, a private company to build, operate and transfer a waste treatment facility in Ddundu.


TECHNICAL PAPER Characterization of municipal waste in Kampala, Uganda Allan J. Komakech,1,2,⁄ Noble E. Banadda,2 Joel R. Kinobe,1,3 Levi Kasisira,2 Cecilia Sundberg,1 Girma Gebresenbet,1 and Björn Vinnerås1
1 Energy and Technology Department, Swedish University of Agricultural Sciences, Uppsala, Sweden 2 Agricultural and Biosystems Engineering Department, College of Agricultural and Environmental Sciences, Makerere University, Kampala, Uganda 3 Civil and Environmental Engineering Department, College of Engineering, Design, Art and Technology, Makerere University, Kampala, Uganda ⁄Please address correspondence to: Allan J. Komakech, Energy and Technology Department, Swedish University of Agricultural Sciences, PO Box 7032, 75007 Uppsala, Sweden; e-mail: allankoma@gmail.com
In Kampala, Uganda, about 28,000 tons of waste is collected and delivered to a landfill every month. Kampala Capital City Authority (KCCA) records show that this represents approximately 40% of the waste generated in the city. The remaining uncollected waste is normally dumped in unauthorized sites, causing health and environmental problems. However, the organic fraction of domestic waste can provide an opportunity to improve livelihoods and incomes through fertilizer and energy production.
This study characterized the municipal waste generated in Kampala and delivered to Kiteezi landfill between July 2011 and June 2012, that is, 15 covering the dry and wet months. On each sampling day, waste was randomly selected from five trucks, sorted and weighed into different physical fractions. Samples of the organic waste from each truck were analyzed for total solids, major nutrients, and energy content. During the wet months, the waste consisted of 88.5% organics, 3.8% soft plastics, 2.8% hard plastics, 2.2% paper, 0.9% glass, 0.7% textiles and leather, 0.2% metals, and 1.0% others. During the dry months, the waste consisted of 94.8% organics, 2.4% soft plastics, 1.0% hard plastics, 0.7% papers, 0.3% glass, 0.3% textile and leather, 0.1% metals, and 0.3% others. The organic 20 waste on average had a moisture content of 71.1% and contained 1.89% nitrogen, 0.27% phosphorus, and 1.95% potassium. The waste had an average gross energy content of 17.3 MJ/kg. It was concluded that the organic waste generated can be a suitable source of some plant nutrients that are useful especially in urban agriculture. Implications: The result of the waste characterization in Kampala was found to be significantly different from that obtained for other Sub-Saharan African (SSA) cities, showing that studies assuming average values for the waste fractions are likely to result in 25 erroneous results. Furthermore, no reduction in organic fraction of the waste was noticed when compared with a study done two decades ago in spite of greatly improved economic status of Kampala city, a finding that is not in agreement with several other similar studies done for other SSA cities.
Introduction Human activities create waste, but it is the way in which 30 these wastes are handled, stored, collected, and disposed of that can pose a risk to the environment and public health. In places with intense human activities such as urban centers, appropriate and safe solid waste management is of great importance in providing healthy living conditions for resi35 dents. Though most governments in developing countries acknowledge this fact, many municipalities struggle to provide even the most basic of services (Zurbrugg, 2003). In the case of Kampala, Uganda, Kampala Capital City Authority (KCCA) is mandated by the Local Government Act of 1997 40 to provide solid waste management services to all five divisions of Kampala City (Banadda et al., 2009, KCCA, 2012). Some of the solid waste management services provided by KCCA include the collection and disposal of wastes from households, market areas, hospitals, industries, and city center 45 areas (National Environment Management Authority [NEMA], 2000).
Efforts to manage wastes in the city are continuously overwhelmed by the ever-increasing population of city residents, increased levels of economic activity, and reduced funding from central government. As a result, incompetence and low service coverage characterize the waste col- 50 lection and disposal system in Kampala City. Most of the time, the services are not on schedule and are only provided in crucial areas such as marketplaces, upscale residential areas, and politically sensitive areas (Tumuhairwe et al., 2009). In an effort to alleviate this situation, KCCA has 55 contracted private companies to assist with the management of solid waste collection so as to improve the cleanliness of the city.
Despite this, less than half the total amount of waste generated, estimated to be 1,500 tonnes per day, is collected (Office of Auditor General [OAG], 2010). The uncollected 60 waste is normally dumped in open areas, streams, open drainage channels, and other areas inaccessible to waste collection vehicles, thus creating environmental and public health hazards for local residents (OAG, 2010)
The solid waste that is collected from the five divisions of Kampala City is dumped at the Kiteezi landfill site, located 12 km from the city center. However, people living near the landfill site have complained that this landfill has made their place uninhabitable and that their land has lost value. These conflicts stem from 70 bad odor, leachate (which pollutes water resources), scattering of wastes from the dumping sites by wind and scavengers like Marabou storks, and other nuisances such as vermin, mosquitoes and flies (Mwiganga and Kansiime, 2005). Furthermore, although landfilling was regarded as an economical and readily available 75 means of municipal solid waste disposal in developing countries (Mwiganga and Kansiime, 2005), high land prices as a result of rising populations and incomes in these areas (Idris et al., 2004) have greatly reduced its economic attractiveness. In addition, landfills are recognized as a major source of anthropogenic 80 methane emissions and an important contributor to global warming, accounting for up to 19% of methane emissions in the world (Kumar et al., 2004). This implies that waste management by landfill disposal is an option that is not sustainable, especially in the face of environmental awareness and concern. It is therefore 85 important to identify other, more sustainable waste management methods for waste generated in Kampala. In this context, it should be noted that domestic waste is a vital resource that, if well exploited, can go a long way toward improving the livelihoods of urban residents.
According to Nzila et al. 90 (2010), biowastes could play a critical role in future energy supply, mainly through thermochemical, physicochemical, and biochemical transformation and conventional combustion. Furthermore, Cofie et al. (2009) reports that the organic fraction of domestic waste can be exploited through composting, thus returning vital 95 nutrients to the soil. According to Amoding (2007), about 50, 10, and 130 metric tonnes per year of nitrogen, phosphorous, and potassium, respectively, are bound up in market crop wastes in Kampala City alone. This provides great potential for nutrient recycling, especially to urban farms, which often require large 100 amounts of nutrients to replace the losses from intensive farming. A comprehensive study on the waste generated in Kampala was conducted in 1989 (Ministry of Lands, Housing and Urban Development [MLHUD], 1993). However, the urban population size and living standards in Kampala have changed significantly 105 since then (NEMA, 2007). The aim of this study was therefore to investigate the mass and composition of the waste entering the Kiteezi landfill site serving Kampala city, in order to determine the potential for recycling organic matter and plant nutrients contained in the waste.
The study included an assessment of the different 110 materials in the waste, as well as the content of energy and nutrients in the organic waste fraction. Moreover, monthly variations and variations between different parts of the city were investigated. Materials and Methods Study area 115 The Kiteezi landfill is an 8-ha site located 12 km from Kampala city center. The landfill is currently operated by the privately owned Otada Construction Company. Upon arrival at the site the waste is weighed and after dumping it is processed by waste pickers, also known as scavengers, for removal of material with a market value, for example, paper, metals, and plastics (Figure 1). 120 Crawler trucks are used to spread and scatter the waste in an effort to stimulate decomposition. The waste is sometimes sprayed with insecticide to kill off flies before it is covered with soil (Mugagga, 2006). The landfill has a leachate treatment plant, which uses mechanical aeration to reduce the biological oxygen demand of 125 the leachate before it is released to the adjacent wetland. The landfill receives waste from surrounding areas as well as from urban Kampala, but in this study the focus was on the latter. Kampala (0150 N; 32300 E) occupies a total area of 190 km2 (Matagi, 2002).
The city is currently experiencing rapid popula- 130 tion growth due to immigration and natural increase (Howard et al., 2003) and is estimated to have a population of 1.5 million inhabitants (KCCA, 2012). Kampala city has five divisions, with Kawempe division being the poorest and the Central division, which includes the Central Business District (CBD), being the 135 wealthiest (Golooba, 2003). Makindye division is mainly a residential area with a mixture of very-low-income and medium- to high- income areas, in addition to being generally periurban in nature (Mugagga, 2006). Kampala’s other divisions are Rubaga, which is more periurban in nature, and Nakawa, which has the 140 highest concentration of rich neighborhoods (Katusiimeh et al., 2013). Sampling and field measurements Five “garbage trucks” entering Kiteezi landfill, one from each of the five different divisions of Kampala, were randomly selected on 145 each day of the analysis using a random number table.
Each selected truck emptied its contents in a preselected area for the analysis. Scavengers already working at the site were employed to manually sort the waste into organics, hard plastics, metals, papers, soft plastics (polythene), glass, textiles and leather, and others, 150 according to Zurbrugg (2003). (The separation of plastic into hard and soft fractions is motivated by the recycling system in Kampala, where these two fractions not only have different prices but are managed as two distinct entities.) The weights of the different fractions were recorded. The organic fraction was then 155 thoroughly mixed and spread out by hand on a 5 m 2 m grid, Figure 1. Kiteezi landfill, Kampala. 2 Komakech et al. / Journal of the Air & Waste Management Association 64 (2014) 1–9 from which 10 samples weighing 1 kg each were randomly collected. These samples were then thoroughly mixed before a final 1-kg sample was drawn for nutrient and energy content analysis. 160 This procedure was repeated for the other selected trucks from the different city divisions each day for 30 consecutive days and thereafter on 2 consecutive days every 2 months.
Thus, on each day, 50 samples were collected. Estimates on the total mass of material entering the landfill during the sampling days and over the whole 165 year were taken from the logbook at the landfill site. Laboratory analyses Moisture content was determined by drying a 5-g subsample at 105C for about 4 hr following the procedure specified by Sluiter et al. (2008). The drying procedure was repeated for two other 170 subsamples and the mean moisture content of the three subsamples was taken as sample moisture content. With the moisture content of sample determined, total solids was calculated as specified by Sluiter et al. (2008). Ten samples were analyzed to determine whether there were any differences in dry moisture 175 content at 70 and 105C. A nonsignificant (P ¼ 0.8364) average difference of 2% was found. Therefore, the analysis of moisture content performed at 105C was used for the study. Waste samples (1 g) were dried in an oven at 70C to reduce the moisture content and milled. To determine total nitrogen, the 180 milled samples were acid digested using sulfuric acid and the total nitrogen concentration was determined by a distillation– titration method. The procedure described by Okalebo et al. (2002) was followed for both the acid digestion and the distillation–titration procedure. To determine total phosphorus, the 185 milled sample was digested using a mixture of nitric and sulfuric acid in a digester at 330C and the total phosphorus was determined using the ascorbic acid method (Okalebo et al., 2002).
To determine potassium, the milled sample was digested using sulfuric acid at 360C for 2 hr and the total potassium concen190 tration was determined by complete oxidation of the sample followed by spectrometric analysis. The procedure described by Okalebo et al. (2002) was followed for digestion, oxidation, and spectrometric analysis. Energy content was determined by forming 1 g of dried sample into a pellet, which was placed in the sample pan of a 195 bomb calorimeter (GallenKamp autobomb, United Kingdom, CAB001.ABC.C). The sample was burned with oxygen in an enclosure of constant volume. The heat liberated by the combustion of all the carbon and hydrogen in the presence of oxygen and the oxidation of other elements that are present in the sample, for 200 example, sulfur, to form carbon dioxide and water gave a measure of the calorific value. All this followed the standard operating procedure (SOP) described by Jessup (1960).
Results Total mass of waste entering the landfill 205 Waste collected by private trucks (companies) could not be assigned to particular divisions since the clients to whom they provide their services are spread across all the divisions of the city. KCCA trucks, on the other hand, collect waste from specific divisions of the city. Therefore, the analysis was limited to waste 210 quantities delivered to the landfill by KCCA trucks. The analysis was done using two-way analysis of variance (ANOVA) in R statistical software following the procedure specified by Venables et al. (2012). It showed a significant difference (P < 0.001) in the waste quantities from the different divisions. Further analysis of this 215 difference using the Tukey test revealed that the waste quantity received from the Central division was significantly greater (P < 0.001) from that from the other divisions. There was no significant difference between waste quantities delivered to the landfill in different months. However, two-way ANOVA indicated 220 a significant difference (P < 0.001) in total solids of the waste for different months. Tukey tests confirmed that total solids content was significantly lower (P < 0.001) in the wet months (April, June, and October) than in the dry months (July, August, December, and February) (Table 1).

Waste composition Physical composition of waste. The most dominant waste fractions in the waste were organics (92%), soft plastics (3%), hard plastics (2%), and paper (1%) (Tables 2 and 3). These and 230 other fractions were analyzed further for significant differences between different months and divisions. Two-way ANOVA showed no significant differences (P > 0.05) in the percentage of waste fractions for metal, glass, textile and leather, and others between the different divi235 sions and months.
However, the same test showed a significant difference (P < 0.001) in the percentage of paper waste between the different divisions and months. Further analysis by Tukey tests revealed that the Central division had a significantly higher (P < 0.001) percentage of paper waste than other divi240 sions. The Tukey test also showed the fraction of paper waste in the months of April, June, and October to be significantly different (P < 0.05) from those of the other months. Waste from Makindye division had the highest content of organics but lowest content of plastics, while that from Nakawa 245 and Rubaga divisions had the lowest organic content but highest plastic content (Table 2).
Two-way ANOVA showed a significant difference (P < 0.001) in the percentage of organic waste fraction between the different divisions. Further analysis by Tukey tests revealed that Makindye had a significantly higher (P < 0.001) percentage of organic waste than either Nakawa or Rubaga. 250 The highest content of organic waste was obtained during July, August, December, and February and the lowest during October, June, and April (Table 3). The highest content of plastic waste (both hard and soft) was obtained during October, June, and April. Two-way ANOVA showed a significant difference 255 (P < 0.001) in the percentage of organic and plastic waste delivered to landfill between the different months.
The Tukey test confirmed that the percentage of organic waste was significantly lower (P < 0.001) in June and October compared to other months. The organic waste fraction delivered in April was also 260 significantly lower (P < 0.05) than that delivered in July and August. During the study period, February, July, August, and December were dry and without rain and are classified as dry months (<100 mm rain per month), while April, June and 265 October were wet, with >150 mm rain per month, and are therefore classified as wet months. The data presented in Table 3 on the composition of waste delivered to landfill in Kampala in


Discussion Physical composition of the waste This study established that on average, about 28,000 tons of municipal waste from Kampala was disposed of in the landfill every month. This waste consisted on average (by weight) of 305 92.1% organic material, 1.8% hard plastic, 0.1% metals, 1.3% papers, 3.0% soft plastic, 0.6% glass, 0.5% textile and leather, and 0.6% others (Table 3). These figures are quite different from those reported for other Sub-Saharan African (SSA) cities like Abuja (Imam et al., 2008), Accra (Fobil et al., 2008,) and 310 Gaborone (Bolaane and Ali, 2004), showing that studies that assume average values for SSA cities may result in erroneous results. Both Henry et al. (2006) and Parrot et al. (2009) reported a reduction in the amount of waste delivered to landfill in Nairobi 315 and Yaoundé, respectively, during the wet season compared with the dry season.
However, in the present study there was no significant difference in the total quantities of waste delivered to landfill in the different months, although there was a significant difference in the quantity of total solids in the waste deliv320 ered during the wet and dry months. This was expected, since the waste had higher moisture content during the wet months than in the dry months. Both Henry et al. (2006) and Parrot et al. (2009) cite impassable roads during the wet season as being the major reason for the reduction in total waste quantity delivered to 325 landfill. Although there are also several impassable roads in Kampala during the wet months, the results of this study indicate that this factor has a minimal effect on the total waste collection. It appears that areas with poor roads are avoided during the wet months, with waste collectors concentrating their services to 330 areas with better roads. In most cases, such areas are more affluent and are most likely to generate less organic waste than less affluent areas.
This could explain the difference observed in waste composition between the different months, with more plastics and paper and less organics in the wet months. It also 335 indicates that the limiting factor in collection is actually transport capacity and not waste generation. Furthermore, the collection of waste in selected areas during the wet months could be responsible for the practice of dumping waste into drainage channels during rain/storm events, which can lead to blockage of the 340 channels and subsequent flooding in low-lying areas (Lwasa, 2004). In addition, the dry months normally coincide with the harvest season for many food crops in the city’s hinterland and periurban areas (Komakech et al., 2013). As such, the city markets are flooded with an abundance of various foods crops 345 at cheaper price (Haggblade and Dewina, 2010). This process of increased availability and consumption of these food crops by the city’s inhabitants could also be responsible for the high prevalence of organic waste during the dry months than during the wet months. 350 The condition of the road network in lower income areas had a bearing on the amount of organics collected. Comparing the organic content of the waste collected from the different divisions of Kampala, Makindye division, which at the time of the study had a better road network in the lower income areas than 355 the other divisions, had the highest organic content. It is likely that the good road network in Makindye facilitated better waste collection in lower income areas, which mainly generate organic waste. A similar finding was reported for Nairobi and other Kenyan cities (Henry et al., 2006). More waste is collected from the Central division (Table 1) 360 because of its political importance. As such, more resources for waste management are provided to it. For example, it is allocated about twice the number of waste collection trucks compared to the other divisions and waste collection is performed 24 hours a day, while in the other divisions it is done for 12 hours a day.
A 365 similar trend was reported for Nairobi city (Henry et al., 2006). Furthermore, the Central division, which contains the CBD, generates more paper waste than other divisions, as expected. It could also have been expected to generate a significantly lower amount of organic waste, but the data showed that this was not 370 the case (Figure 3). This could be due to the large number of scavengers in the Central division, who retrieve material that can be reused or recycled, leaving behind the organic fraction, which they regard as low value (Dangi et al., 2011). There are also several large markets in the Central division, which significantly 375 increase the amount of organic material generated in that division. A study in 1989 reported that the waste in Kampala consisted of (by weight): vegetable matter 73.8%, paper 5.4%, sawdust 1.7%, plastics 1.6%, metals 3.1%, glass 0.9%, tree cuttings 380 8.0%, and street debris 5.5% (MLHUD, 1993). This reflected a time when Kampala was entering economic growth after the devastating wars of the mid 1980s.
This is shown by the unusually high amount of tree cuttings in the waste, generated as a result of virgin land being cleared to set up various structures 385 Figure 3. Box plot of the fraction of organic waste in the five different divisions of Kampala City. 6 Komakech et al. / Journal of the Air & Waste Management Association 64 (2014) 1–9 such as buildings and roads. In addition, during that period many industries had not yet been revived, a factor that explains the higher metal quantity and lower plastic quantity in the waste. In the present study, vegetable matter, sawdust, and tree cuttings 390 were considered organic waste. Applying the same principle to the study by MLHUD (1993) would give an organic waste fraction of 87.9%, which is close to what this study established.
Although some studies report a reduction in the organic fraction of the waste with the increased economic status of an SSA city 395 (NEMA, 2007; Oteng-Ababio et al., 2013), this finding is not necessarily true, as shown by this study. Other factors such as population growth (Chang and Davila, 2008), consumption behavior, and awareness of material recycling (Cox et al., 2010) could also play a critical role in determining the sizes of 400 the different fractions of a city’s waste. There were also great discrepancies in the amounts of metals, plastic, and street debris between the two studies.
The most likely reason for this is the absence of metal recycling industries in 1989. However, the metal recycling industry, and by implication trade in scrap 405 metal, is now a highly lucrative venture as a result of the great increases in metal prices on the world market. The demand for scrap metal is extremely high, a factor that has contributed to the increase in the incidence of thefts of metal objects such as manhole covers, road signs, railway sleepers, fences, guard rails, and 410 streetlights (Nyapendi, 2011).
This also explains the low fraction of metals in the municipal waste at present. The large fraction of plastic waste currently entering the landfill can be attributed to the increased number of supermarkets and shops that provide their customers with free plastic carrier bags, as well as the 415 increased use of plastic mineral-water bottles compared with 1989. The reduced amount of street debris is probably a result of street debris being collected from nearly the same length of streets as in 1989, yet the population generating other types of wastes has increased tremendously. 420 It is worth noting that a number of scavengers work at the landfill. Although they are interested in salvaging anything of value from the waste, according to Mugagga (2006) their main interest is in paper, scrap metal, cardboard, and plastics.
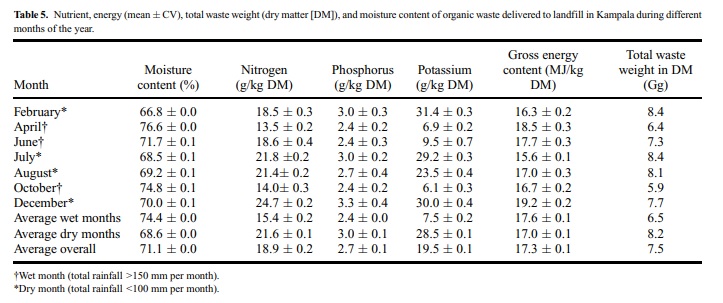
These they sell mainly to traders and some plastic recycling industries. 425 Scavengers play a vital role in reduction of the waste volumes at the landfill, as according to Mugagga (2006) they remove an estimated 1 ton of waste per day. An important finding of the present study is that hazardous wastes (represented by dry-cell batteries) were hardly found at all 430 in the municipal waste analyzed. This is probably because they are mainly disposed of in pit latrines, owing to a widespread myth that this increases the service lives of the latrines through lowering the sludge levels. This has major implications for the chemical quality of the fecal sludge found in the latrines, which 435 is a large potential source of plant nutrients in Uganda. Medical wastes were also not found in the municipal waste analyzed, reflecting the success of programs to educate waste collectors about the types of waste they should bring to the landfill. Chemical composition of the waste 440 The average nutrient composition of the organic fraction in Kampala municipal waste during the dry months was 2.16% nitrogen, 0.30% phosphorus, and 2.85% potassium (Table 5).
During the wet months, it was 1.54% nitrogen, 0.24% phosphorus, and 0.75% potassium. This translates into an average of 5900, 900 and 6000 Mg of nitrogen, phosphorus, and potas- 445 sium in the organic fraction of the waste delivered to landfill annually in Kampala. An explanation for the larger amount of nutrients during the dry months is that the time, as discussed in the previous section, normally coincides with the harvest period for many crops (Haggblade and Dewina, 2010). Therefore, it is 450 possible that crop wastes (and their constituent nutrients) could be present in significantly higher amounts in the organic waste during the dry months than in the wet months. One of the most widely eaten foods in Kampala is bananas, locally known as matooke, and their harvest time coincides with the dry months 455 (Haggblade and Dewina, 2010). This would also explain the unusually high amount of potassium in the organic waste during the dry months as opposed to the wet months. Furthermore, according to Table 5, the nitrogen concentration in the organic fraction was highest in December.
This could probably be 460 explained by a wider variety of foodstuffs being consumed during the festive season, including food with high protein content such as meat. Amoding (2007) established that market wastes in Kampala city contain on average 1.57% nitrogen, 0.21% phosphorus, and 465 2.95% potassium. Comparing the present results with those, it can be seen that results of this study for the dry months were fairly similar, confirming our assumption that crop waste dominated the organic waste fraction generated in the dry months. Cofie et al. (2009) reported the quality of co-compost from a 470 pilot plant using fecal sludge and organic waste in Kumasi, Ghana, to be 1.19% nitrogen, 1.6% phosphorus, and 1.7% potassium. Comparing the results of Kampala with those from Kumasi, it can be concluded that it is possible to get a superior quality of co-compost from municipal waste in Kampala. 475 The average gross energy content of the organic factions was 17.3MJ/kg DM (Table 5).
This figure is quite similar to the 18.0 MJ/kg DM reported by Bingh (2004), showing that the organic waste has a potential for energy recovery through incineration. However, its high average moisture content of 71% is likely to 480 make incineration an uneconomical option (Kathirvale et al., 2004). The annual landfilling of plant nutrients from organic waste in Kampala corresponded to 92, 110, and 680%, respectively, of the amounts of mineral nitrogen, phosphorus, and potassium 485 fertilizer imported to Uganda annually (FAO., 2010). The plant availability of the nitrogen in organic material is lower than that in mineral fertilizer, but anaerobic treatment would increase the availability of the nitrogen in the organic material. The availability of phosphorus and potassium is more similar to that in 490 mineral fertilizer. In addition, the organic material contains other micronutrients required by plants, as well as organic material that improve the soil structure considerably.
This indicates the high potential of reusing this fraction, which could even have a great impact on the national economy, as it would increase the self- 495 sufficiency considerably. The energy content in the material collected annually corresponded to 1.6 109 MJ. If this material were processed in a biogas plant and 50% were converted into biogas, 8.0 108 MJ Komakech et al. / Journal of the Air & Waste Management Association 64 (2014) 1–9 7 500 of biogas could be expected to be produced. This could be used for electricity production or as vehicle fuel. Thus, diverting organic waste from landfill into recycling of energy and plant nutrients could provide great opportunities for the future. Conclusion 505 Analysis of the physical composition of the municipal waste generated in Kampala city revealed that it consisted mainly of organic material (92.1%), soft plastic (3.0%), hard plastic (1.8%), and paper (1.1%).
The average chemical composition of its organic fraction was 71% moisture, 1.89% nitrogen, 0.27% 510 phosphorus, and 1.73% potassium. The plant nutrients in landfilled organic waste from Kampala corresponded to 92, 110, and 680% of imported fertilizer nitrogen, phosphorus, and potassium, respectively. The waste also had a gross energy content of 17.3 MJ/kg. Both the physical composition and the chemical 515 composition of the waste varied depending on whether the month was dry or wet, while the physical composition also varied depending on the city division generating the waste. Recycling of some fractions of the waste is being successfully carried out in some divisions already. The organic waste, although suitable for 520 production of compost, is not suitable for energy recovery through incineration owing to its high moisture content.
Further studies are needed to further classify the organic waste into its physical components and other chemical components not tested in this study.
Funding.
We thank Swedish International Development Cooperation Agency (SIDA) and the Swedish Foreign Affairs Ministry (UD40) for initiating the collaboration and sponsoring the research. We thank KCCA staff members, especially Kenneth 530 Kyazze, for all the assistance rendered in the physical characterization of waste at the Kiteezi landfill. We also thank the College of Agriculture and Environmental Sciences, Makerere University, for provision of laboratory services. References 535 Amoding, A. 2007. Supply potential and agronomic value of urban market crop waste. PhD Thesis, Makerere University. Banadda, E.N., F. Kansiime, M. Kigobe, M. Kizza, and I. Nhapi. 2009. Landusebased nonpoint source pollution: A threat to water quality in Murchison Bay, Uganda.
Water Policy 11(Suppl. 1):93–104. 540 Bingh, L. P. 2004. Opportunities for utilising waste biomass for energy in Uganda. Master’s thesis, Department of Energy and Process Engineering, Norwegian University of Science and Technology. Bolaane, B., and M. Ali. 2004. Sampling household waste at source: Lessons learnt in Gaborone. Waste Manage. Res. 22 (3):142–48. doi:10.1177/ 545 0734242×04044970 Chang, N.-B., and E. Davila. 2008. Municipal solid waste characterizations and management strategies for the Lower Rio Grande Valley, Texas. Waste Manage. 28 (5):776–94. doi:http://dx.doi.org/10.1016/j.wasman.2007.04.002 Cofie, O.O., P. Drechsel, S. Agbottah, and R.V. Veenhuizen. 2009. Resource recovery 550 from urban waste: Options and challenges for community-based composting in sub-Saharan Africa. Desalination 248: 256–61. doi:10.1016/j.desal.2008.05.063 Cox, J., S. Giorgi, V. Sharp, K. Strange, D.C. Wilson, and N. Blakey. 2010.
Household waste prevention—A review of evidence. Waste Manage. Res. 28: 193–219. doi:10.1177/0734242X10361506 Dangi, M.B., C.R. Pretz, M.A. Urynowicz, K.G. Gerow, and J.M. Reddy. 2011. 555 Municipal solid waste generation in Kathmandu, Nepal. J. Environ. Manage. 92: 240–49. doi:10.1016/j.jenvman.2010.09.005 FAO. 2010. FAO Statistical Yearbook 2010. http://www.fao.org/economic/ess/ ess-publications/ess-yearbook/ess-yearbook2010/yearbook2010-reources/en (accessed December 2, 2013). 560 Fobil, J.N., N.A. Armah, J.N. Hogarh, and D. Carboo. 2008. The influence of institutions and organizations on urban waste collection systems: An analysis of waste collection system in Accra, Ghana (1985–2000). J. Environ. Manage. 86 (1):262–71. doi:10.1016/j.jenvman.2006.12.038 Golooba, M.F. 2003. Devolution and outsourcing of municipal services in 565 Kampala city, Uganda: An early assessment. Public Admin. Dev. 23: 405–18. Haggblade, S., and R. Dewina. 2010. Staple food prices in Uganda. Paper read at COMESA policy seminar on variation in staple food prices: Causes, consequence, and policy options, Maputo, Mozambique. Henry, R.K., Y.S. Zhao, and J. Dong. 2006. Municipal solid waste management 570 challenges in developing countries—Kenyan case study. Waste Manage. 26 (1):92–100. doi:10.1016/j.wasman.2005.03.007 Howard, G., S. Pedley, M. Barrett, M. Nalubega, and K. Johal. 2003. Risk factors contributing to microbiological contamination of shallow groundwater in Kampala, Uganda. Water Res. 37 (14):3421–29. doi:10.1016/s0043-1354 575 (03)00235-5 Idris, A., B. Inanc, and M.N. Hassan. 2004. Overview of waste disposal and landfills/dumps in Asian countries. J. Material Cycles Waste Manage. 6 (2):104–10. Imam, A., B. Mohammed, D.C. Wilson, and C.R. Cheeseman. 2008. Solid waste 580 management in Abuja, Nigeria. Waste Manage. 28 (2):468–72. doi:10.1016/ j.wasman.2007.01.006 Jessup, R.S. 1960. Precise Measurement of Heat of Combustion with a Bomb Calorimeter. Natl. Bar. Std. U.S. Monograph no. 7. http://digital.library.unt. edu/ark:/67531/metadc13253/m2/1/high_res_d/NBS%20Monograph%207. 585 pdf (accessed December 10, 2013). Kampala Capital City Authority. 2012. Kampala Capital City Authority official website. http://www.kcca.go.ug/services (accessed November 11, 2012). Kathirvale, S., N.M.N. Yunus, K. Sopian, and A.H. Samsuddin. 2004. Energy potential from municipal solid waste in Malaysia. Renewable Energy 29 590 (4):559–67. doi:10.1016/j.renene.2003.09.003 Katusiimeh, M.W., C.P.J. Burger, and A.P.J. Mol. 2013. Informal waste collection and its co-existence with the formal waste sector: The case of Kampala, Uganda. Habitat Int. 38: 1–9. doi:10.1016/j.habitatint.2012.09.002 Komakech, A.J., N.E. Banadda, G. Gebresenbet, and B. Vinnerås. 2013. Maps of 595 animal urban agriculture in Kampala City. Agron. Sustain. Dev. :1–8. doi: 10.1007/s13593-013-0164-7 Kumar, S., S.A. Gaikwad, V.A. Shekdar, P.S. Kshirsagar, and R.N. Singh. 2004. Estimation method for national methane emission from solid waste land lls. Atmos. Environ. 38: 3481–487. doi:10.1016/j.atmosenv.2004.02.057 600 Lwasa, S. 2004. Urban expansion processes of Kampala in Uganda: Perspectives on contrasts with cities of developed countries. http://www. populationenvironmentresearch.org/papers/Lwasa_contribution.pdf (accessed December 11, 2013). Matagi, S.V. 2002. Some issues of environmental concern in Kampala, the capital city 605 of Uganda. Environ. Monit. Assess. 77 (2):121–38. doi:10.1023/a:1015860820467 Ministry of Lands, Housing and Urban Development. 1993. Kampala Urban Study. Phase One Report, Ministry of Lands, Housing and Urban Development (MLHUD), Republic of Uganda. Mugagga, F. 2006. The Public–Private Sector Approach to Municipal Solid 610 Waste Management. How Does It Work in Makindye Division, Kampala District, Uganda. 136. http://ntnu.diva-portal.org/smash/record.jsf? pid=diva2:126252 (accessed December 11, 2013). Mwiganga, M., and F. Kansiime. 2005. The impact of Mpererwe landfill in Kampala-Uganda, on the surrounding environment. Phys. Chem. Earth 30 615 (11–16): 744–50. doi:10.1016/j.pce.2005.08.016 National Environment Management Authority. 2000. State of the Environment Report for Uganda 1999/2000. National Environment Management Authority, Kampala, Uganda. 8 Komakech et al. / Journal of the Air & Waste Management Association 64 (2014) 1–9 620 National Environment Management Authority. 2007. State of Environment Report for Uganda 2006/2007. National Environment Management Authority, Kampala, Uganda. Nyapendi, M. 2011. Who is stealing manhole covers. The New Vision Newspaper, Uganda. May 18. http://development.www.enteruganda.com/D/9/32/755031 625 (accessed December 24, 2012). Nzila, C., J. Dewulf, H. Spanjers, H. Kiriamiti, and H.V. Langenhove. 2010. Biowaste energy potential in Kenya. Renew. Energy 35: 2698–704. doi:10.1016/j.renene.2010.04.016 Office of Auditor General. 2010. Value for money audit report on solid waste 630 management in Kampala. Office of Auditor General (OAG), Republic of Uganda. Okalebo, J.R., K.W. Gathua, and P.L. Woomer. 2002. Laboratory Methods of Soil and Plant Analysis: AWorking Manual, 2nd ed. Nairobi, Kenya: TSBF-CIAT and SACRED Africa. 635 Oteng-Ababio, M., J.E.M. Arguello, and O. Gabbay. 2013. Solid waste management in African cities: Sorting the facts from the fads in Accra, Ghana. Habitat Int. 39: 96–104. doi:10.1016/j.habitatint.2012.10.010 Parrot, L., J. Sotamenou, and B.K. Dia. 2009. Municipal solid waste management in Africa: Strategies and livelihoods in Yaounde, Cameroon. Waste Manage. 640 29 (2):986–95. doi:10.1016/j.wasman.2008.05.005 Sluiter, A., B. Hames, D. Hyman, C. Payne, R. Ruiz, C. Scarlata, J. Sluiter, D. Templeton, and J. Wolfe. 2008. Determination of total solids in biomass and total dissolved solids in liquid process samples. Laboratory Analytical Procedure. Technical report NREL/TP-510-42621. http://www.nrel.gov/ 645 docs/gen/fy08/42621.pdf. Tumuhairwe, J.B., J.S. Tenywa, E. Otabbong, and S. Ledin. 2009. Comparison of four low-technology composting methods for market crop wastes. Waste Manage. 29 (8):2274–81. doi:10.1016/j.wasman.2009.03.015 Venables, W., N., D.M. Smith, and R Core Team. 2012. An Introduction to R. Notes on R: A programming environment for data analysis and graphics. 650 Version 2.15.1 (June 22). Zurbrugg, C. 2003. Urban solid waste management in low-income countries of Asia how to cope with the garbage crisis. Presented to Scientific Committee on Problems of the Environment (SCOPE) Urban Solid Waste Management Review Session, Durban, November 2002, South Africa. 655 About the Authors Allan J. Komakech is a PhD student at Department of Energy and Technology, Swedish University of Agricultural Sciences at Uppsala, Sweden and an assistant lecturer at Department of Agricultural and Biosystems Engineering Department, Makerere University, Kampala, Uganda. Noble E. Banadda is a professor and Chair, Department of Agricultural and Biosystems Engineering. Joel R. Kinobe is a PhD student on a sandwich program between the Department of Energy and Technology, Swedish University of Agricultural Sciences at Uppsala, Sweden and the Department of Civil and Environmental Engineering, Makerere University. Levi Kasisira is an associate professor at the Department of Agricultural and Biosystems Engineering. Girma Gebresenbet is a professor and Björn Vinnerås and Cecilia Sundberg are associate professors at the Department of Energy and Technology, Swedish University of Agricultural Sciences.
Also read https://hicginewsagency.com/2020/10/24/kcca-secures-new-site-for-waste-management/

This reality since 2019 why I saying that because this reason was occasionally here because they listen digital systems coming down payment assistance but they used fake document appears here and false positive but not issues on me but the issue is kcca gave tender many companies to collect rubbish but every room in city paying 25000|= per month this room is small if big pay less 50000/= 100000/= but those many where we’re going? Because always tell people different issues on rubbish but not good in community because as ssempijja Silver take time to monitor everyone through here and I sure many documents fake forms but used system to figure out with out asked me how can we solve this issues but because they listen that man is poor person no one can help we have used it and doing what we want this is Way destroy myself ssempijjasilver2@gmail.com but in friendship and relationship I have last idea about rubbish as kcca they are going to fighting with rubbish but all they forget my system digital platform and names used to destroy and damaged but I want any person concerned about this issues in kcca take this message and reading careful today to close and stopping them habits behind them make new laws attached with digital systems then remove all issues in News paper bring here to solve it immediately in not they’re free to saying not or nothing because they have permission on myself ssempijjasilver2@gmail.com and power if they’re seeing no one has permission today cool down next weekend coming here to introduce myself ssempijjasilver2@gmail.com am here at Kampala Uganda Ben kiwanuka street pioneer view building but the fact to agree all as council to get my passport book and national I’d Free and other facilities that All then all work going on and all will be decrease but if they are not respecting footprint person they’re taking too long time to reach whare they love to stay. Mr. Lukwago and your cabinet and Mr kyofatogabye check them sleeves thanks am ssempijja Silver this my national I’d card names check my details if you’re interested More information
LikeLike